Non-Structural Elements in Earthquakes: Field Fragility and Recovery Lessons from Japan
This post summarises O'Reilly, Hasegawa, Shahnazaryan, Poveda, Fukutomi, Kusaka and Nakashima (2023), Earthquake Engineering & Structural Dynamics, doi:10.1002/eqe.4066.
For building owners, both findings change the answers after an earthquake: how much damage to expect, and how much of it needs fixing before the building works again. We use them in our post-event decision support; the last part of this post shows how monitoring data becomes decisions.

Why do non-structural elements matter?
Non-structural elements (NSEs) are the parts of a building that do not carry its loads: partitions, doors, windows, ceilings, piping, mechanical services, cladding, furniture and contents.
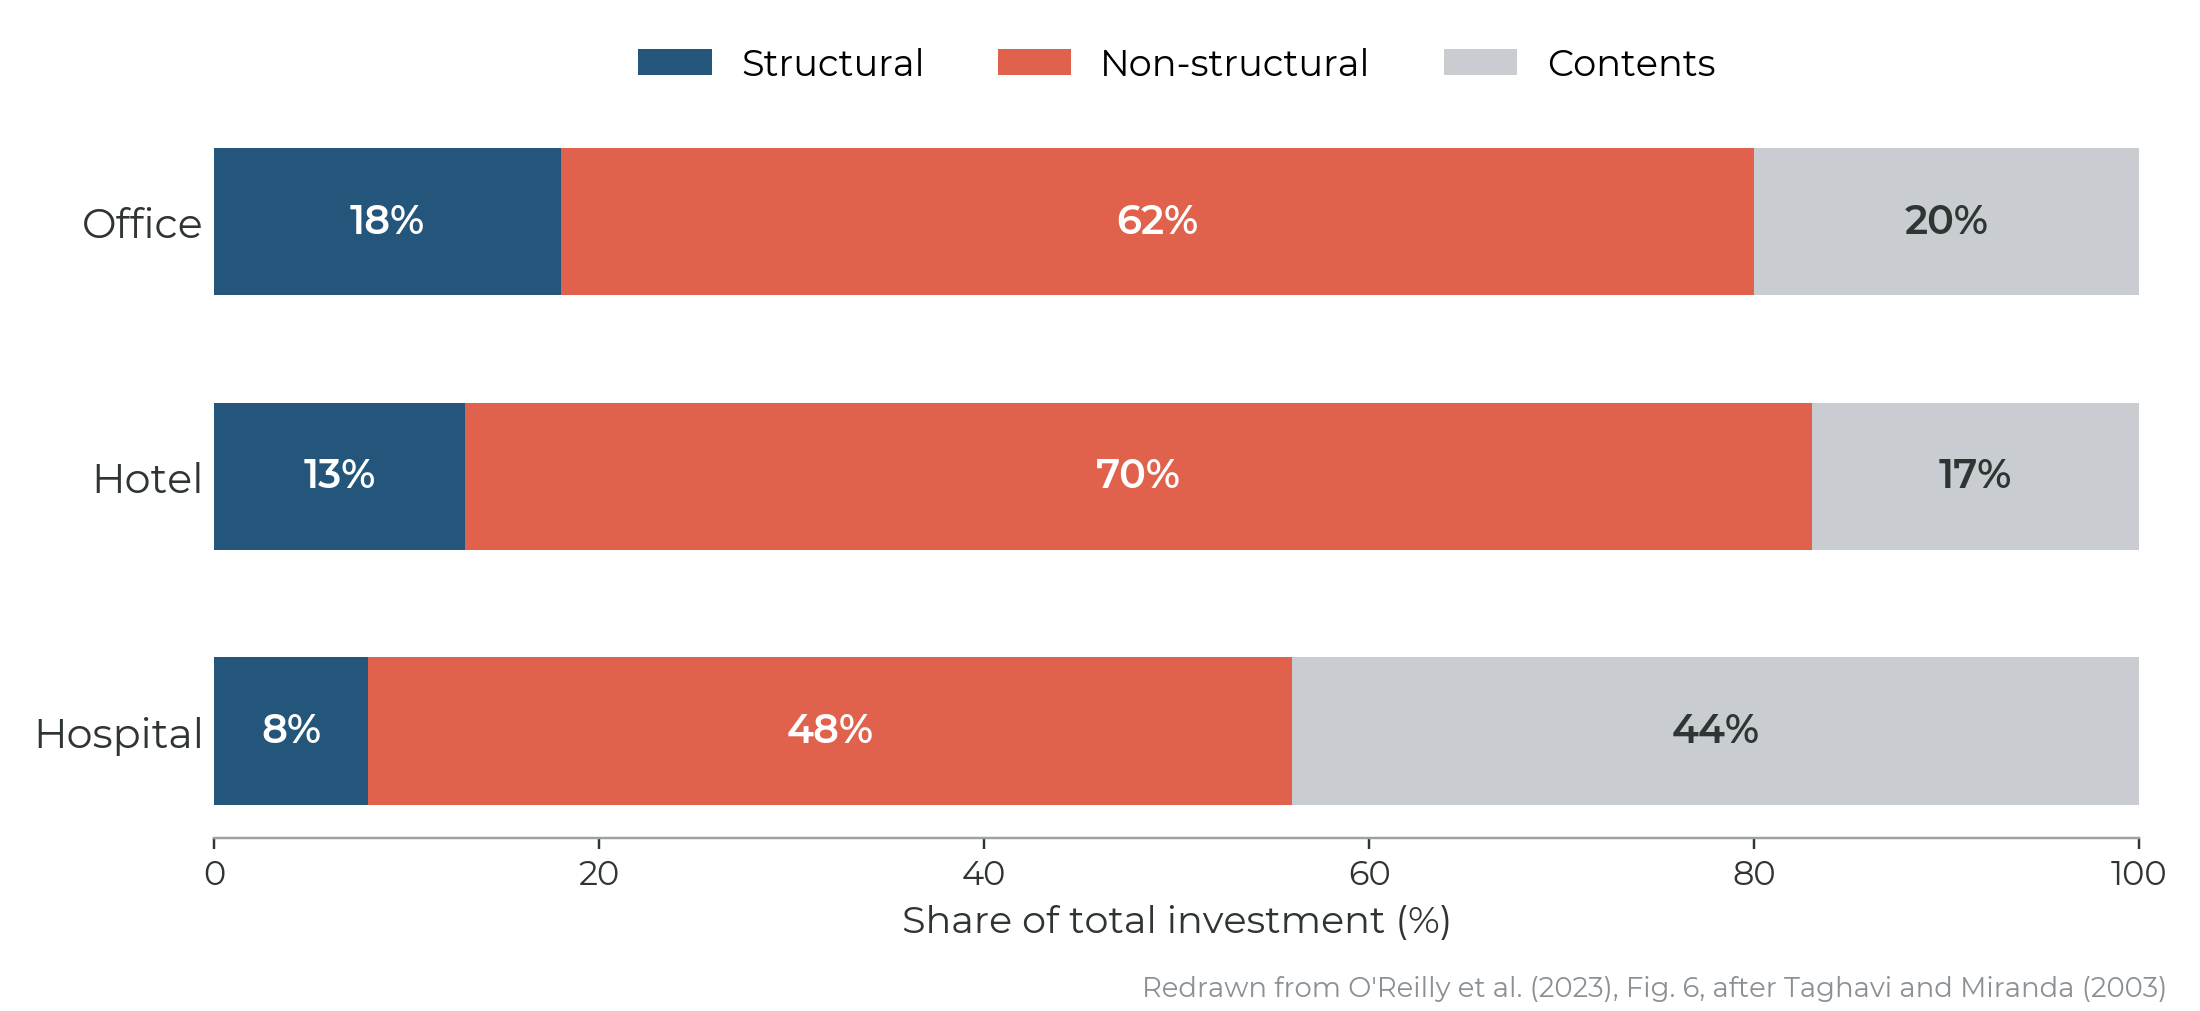
Seismic codes were written to protect lives, so for most of the last century the structural frame got the attention. Yet as early as 1929, Engle noted that a building whose partitions and finishes are badly damaged is useless after an earthquake, even if the frame survives, and that the frame seldom exceeds 15% of a building's cost. Taghavi and Miranda (2003) later showed the same split for office, hotel and hospital buildings: most of the investment is in non-structural components and contents.
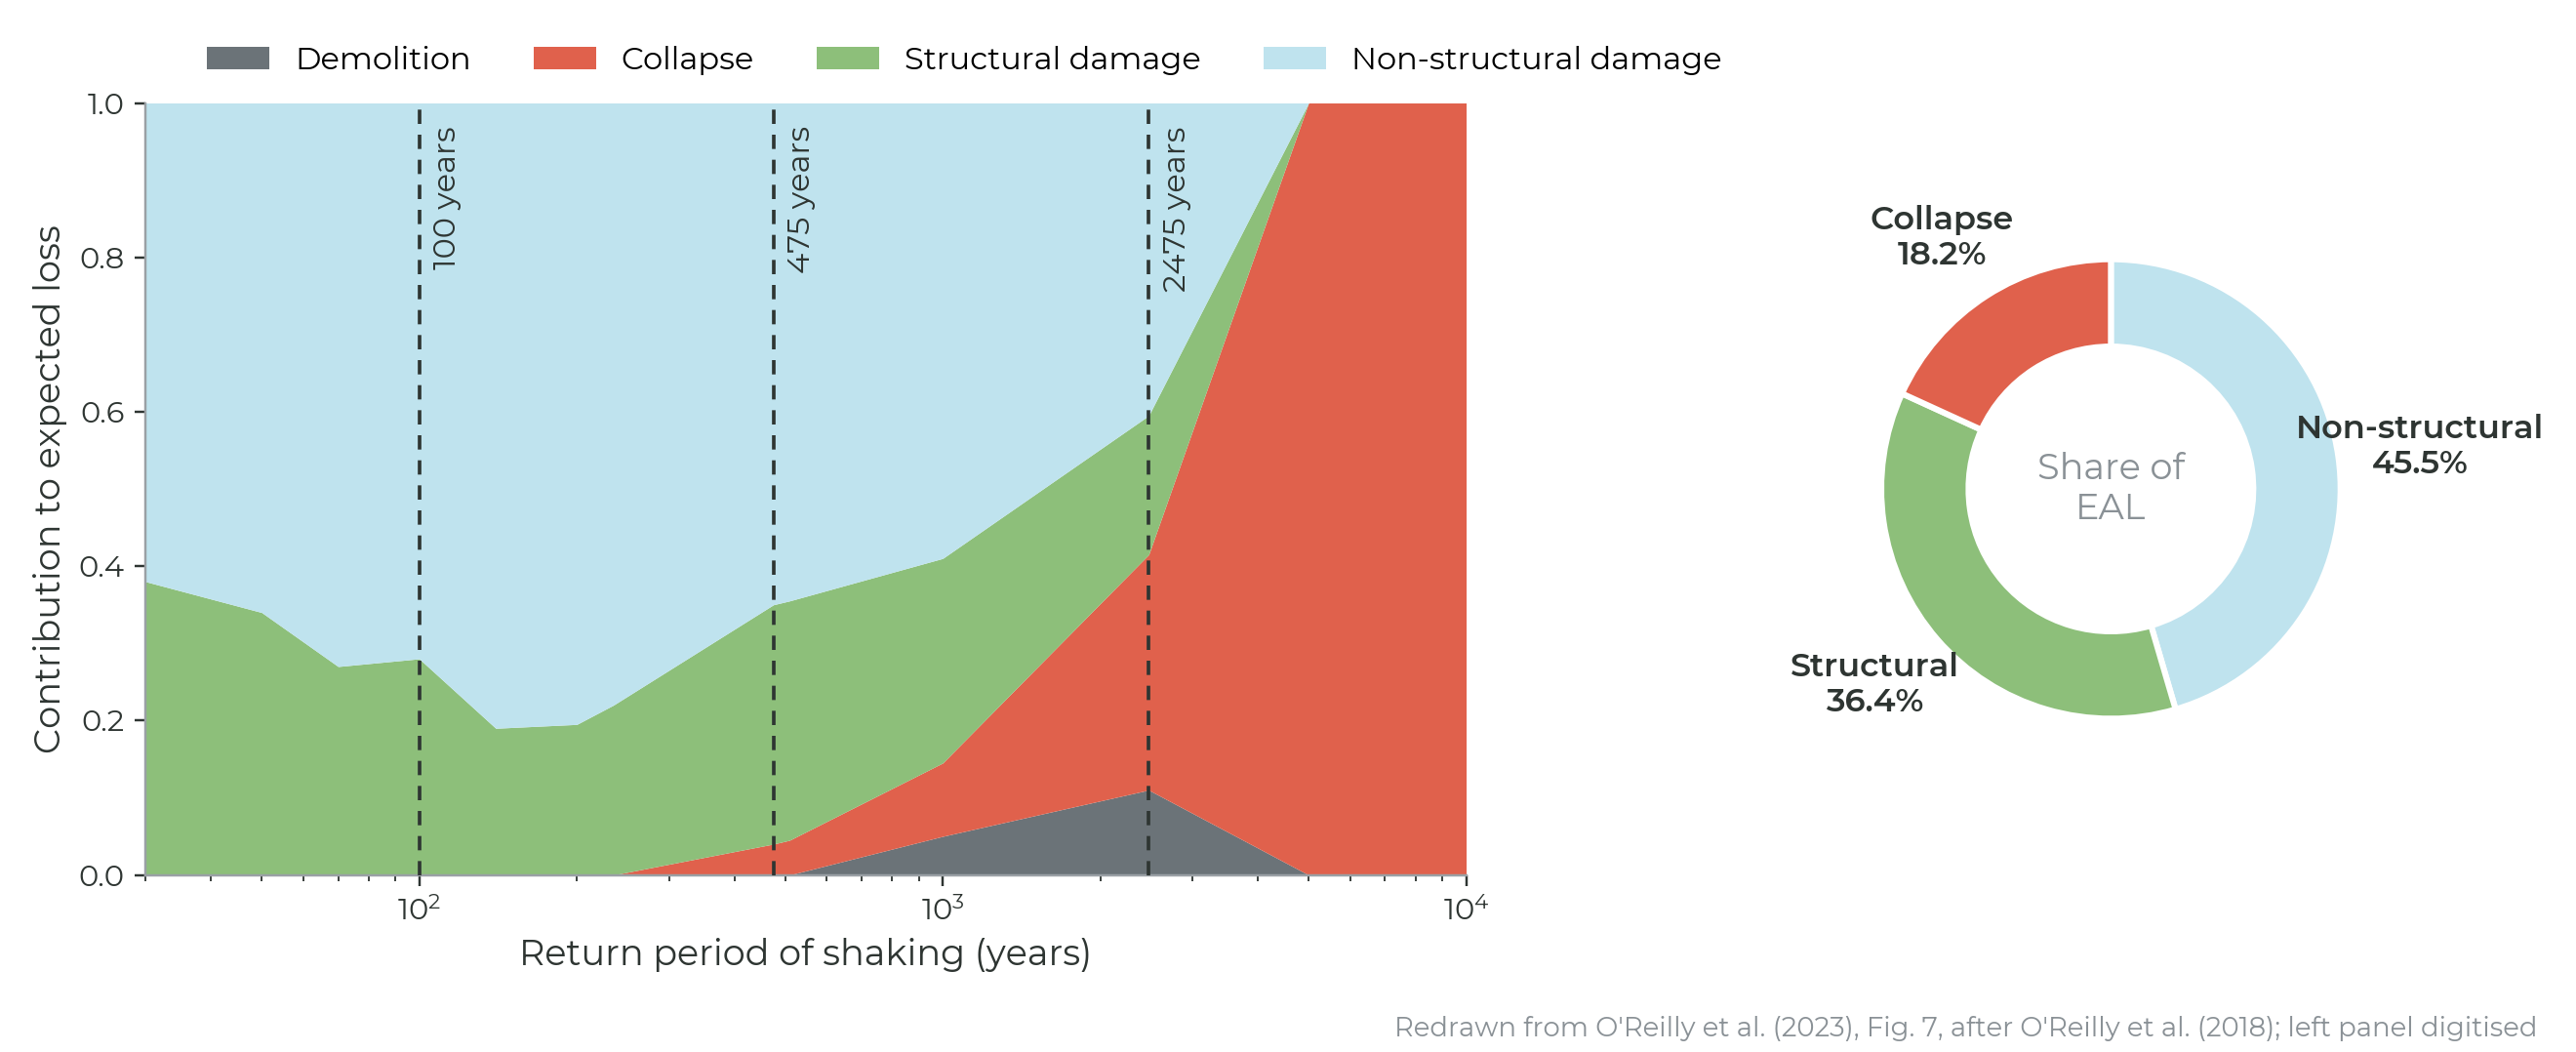
Loss assessment confirms it. In a school building in central Italy studied by O'Reilly et al. (2018), NSEs dominated the expected loss for every return period up to about 900 years and contributed over 45% of the expected annual loss (EAL). Damage to NSEs starts at low intensities, and low intensities happen often, so NSEs drive the annual average. Many studies of steel, reinforced concrete and infilled buildings reached the same conclusion.
So the fragility functions used for NSEs, and the repair actions assumed for them, carry a lot of weight in any loss estimate. The paper examines both.
How are NSE fragility functions derived?
A fragility function gives the probability that a component reaches or exceeds a damage state (DS) for a given engineering demand parameter (EDP), such as peak storey drift for a partition or peak floor acceleration for a ceiling. It is usually lognormal:
where is the median demand at which the damage state occurs and is the dispersion. If you need a refresher, see what a fragility curve is and how it differs from a vulnerability curve.
Porter et al. (2007) describe six ways to derive the median and dispersion: from test data where the damage was observed (A), bounded (B) or only capable (C), from numerical models (D), from expert opinion (E), and by updating an existing function with new observations (U). These methods are the basis of Appendix H of FEMA P-58, whose PACT library holds over 700 fragility functions. Most of them for NSEs come from laboratory tests.
Why might laboratory fragility not match real buildings?
The paper sets out five reasons why a fragility function derived from a laboratory test may not represent the same component in a building:
- Installation conditions. NSE behaviour depends heavily on connections and boundary conditions, and a test rig can only approximate them. Shake-table tests on partition walls found that the boundary condition alone changed seismic fragility by up to 42% (Huang et al. 2022).
- Loading protocols. The number and amplitude of cycles, and how the load is applied, differ between test campaigns. Combining results from inconsistent set-ups may not be strictly correct.
- Interaction with other elements. A single specimen cannot capture a ceiling hit by a service pipe, or contents ruined by water from a burst pipe. After the 2011 Tohoku earthquake, much of the NSE damage came from such interactions rather than from shaking of the element itself.
- Quality of workmanship. A contractor building a few specimens that will be closely inspected will probably take more care than when installing dozens in a real building.
- Wear, tear and unanticipated interventions. Doors opened for years, pipes maintained or re-braced, holes cut in partitions, glazing replaced, slight damage from past small earthquakes: none of this is in a pristine test specimen.
FEMA P-58 accounts for these uncertainties by increasing the dispersion . It does not lower the median. Given the issues above, the authors argue it would be reasonable to expect real components to be more vulnerable, with a lower median, and not only more uncertain.
Better laboratories help. The E-Defense shake table in Japan has tested full buildings with their NSEs installed, and facilities such as the 9DLAB at the EUCENTRE Foundation load NSEs between two floor levels at once. Another route is to learn from components in their real condition, in real buildings, during real earthquakes. That is where monitoring comes in.
Fragility functions from monitoring data: the 2018 Osaka earthquake
Japan has been instrumenting buildings with structural health monitoring (SHM) systems for decades, and the pace increased after the 2011 Tohoku earthquake. Kanda et al. (2021) report around 500 instrumented buildings in 2016 and around 850 in 2018. One commercial system, q-NAVI, had been installed in over 500 buildings by 2021. It records floor accelerations, from which peak storey drifts are obtained by integration, and recorded large amounts of data during the 2018 Osaka and 2018 Hokkaido Eastern Iburi earthquakes.
The data
The study used data from 26 office buildings surveyed after the 2018 Osaka earthquake:
- seven to twenty storeys, built between 1974 and 2009;
- no significant structural damage in any of them;
- maximum floor demands from q-NAVI;
- damage collected mostly from interviews with building managers about two months after the event, checked against photos taken immediately after the earthquake;
- damage recorded as binary: the element was either damaged or not.
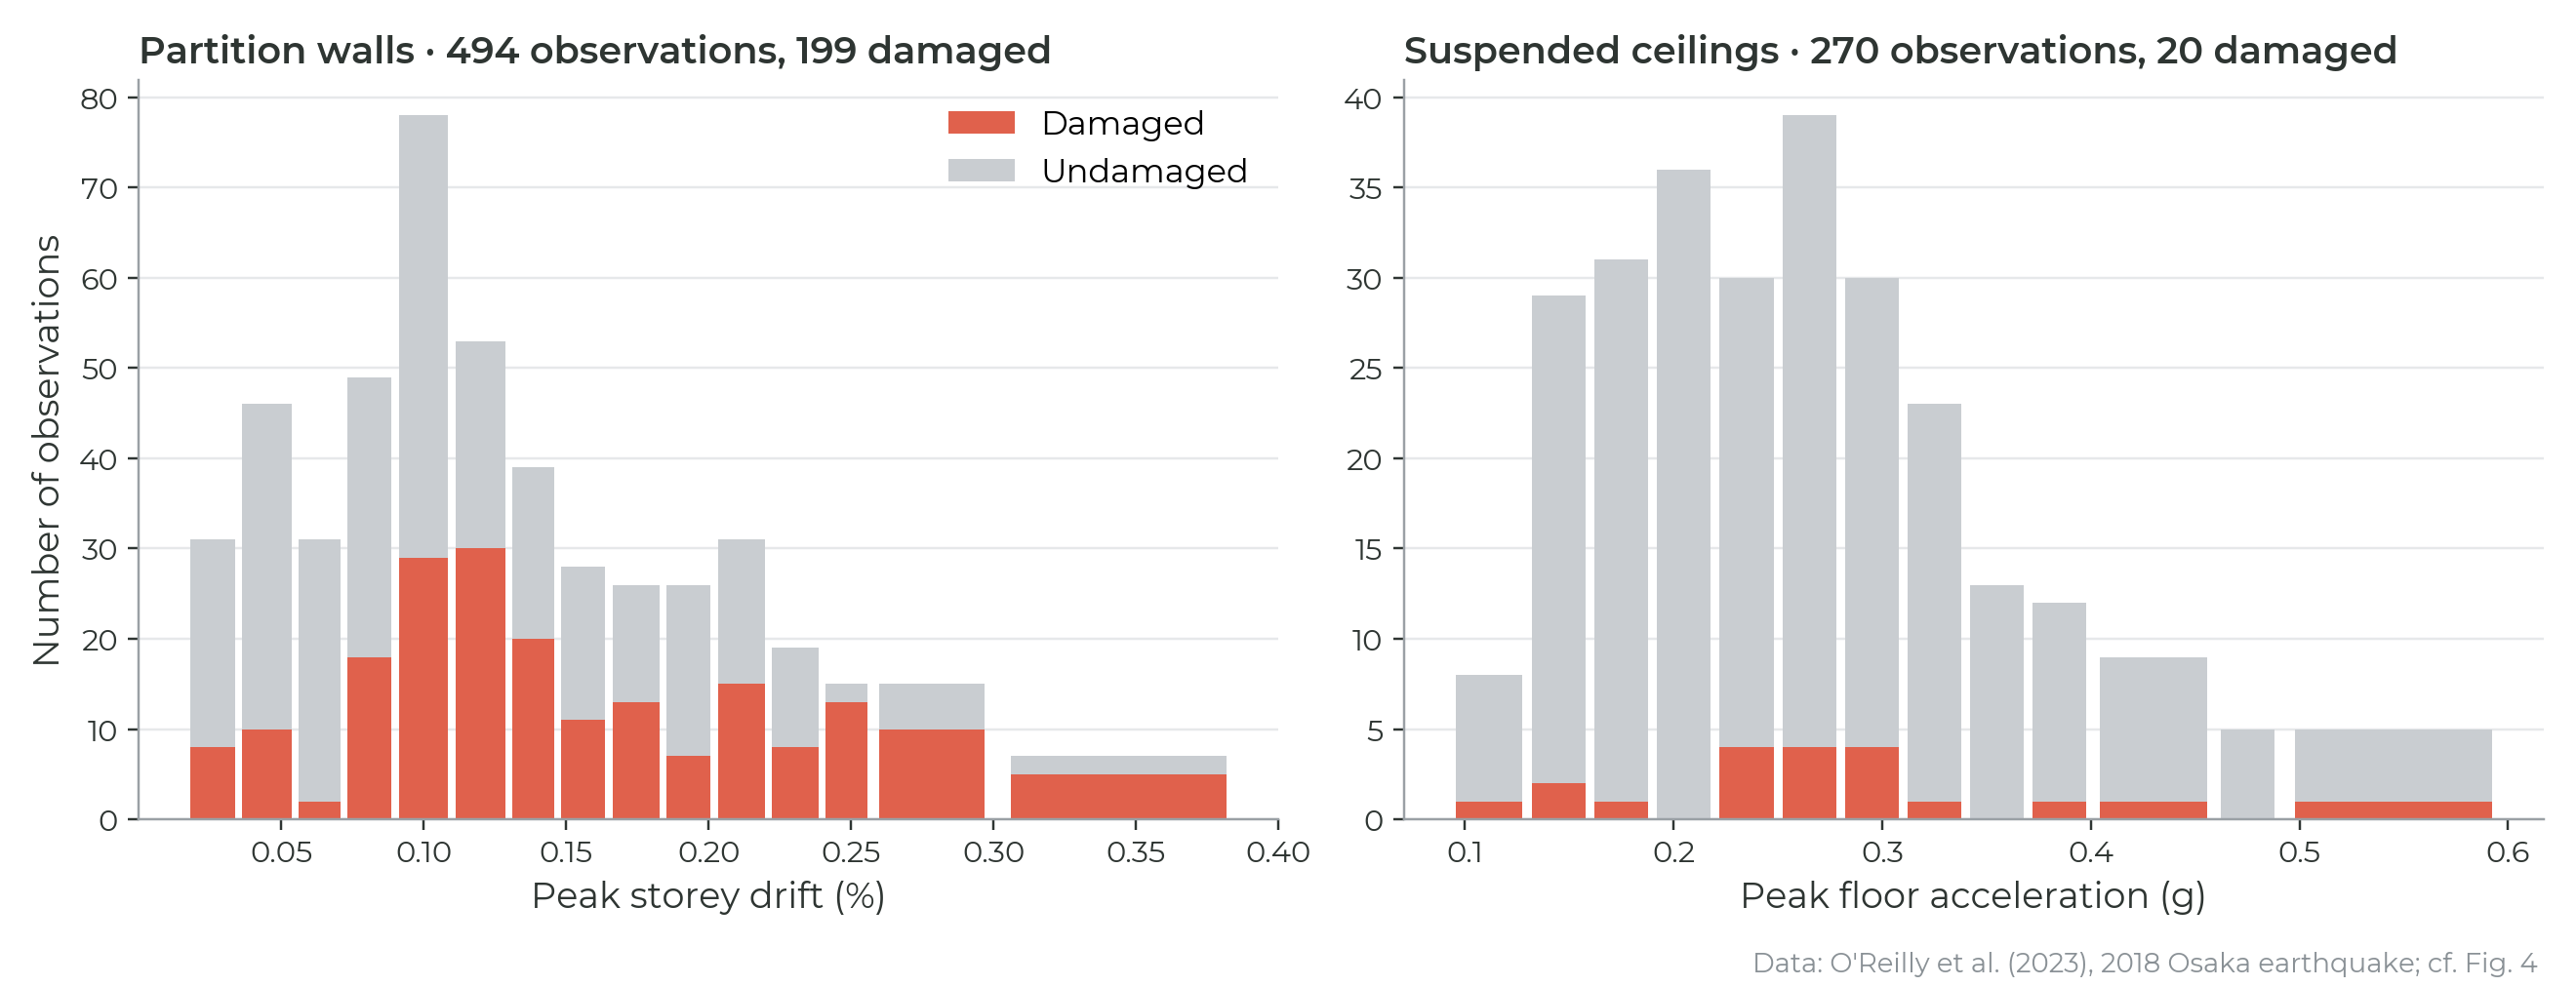
Eight NSE types were surveyed, but detailed information was only available for partition walls, with 494 observations, and suspended ceilings, with 270 observations. These were also the elements with the most significant damage, and partitions were damaged far more often than ceilings: 199 of the 494 partition observations recorded damage, against 20 of the 270 ceiling observations.
Fitting the fragility functions
Field data look different from test data. In a test, you know the exact demand at which each damage state occurred. From SHM and a survey, you only know the maximum demand each element saw, and whether it ended up damaged.
The study first applied Method B of Porter et al. (2007), as per FEMA P-58: bin the observations by demand, estimate the probability of damage in each bin, and fit a lognormal by least-squares regression. The fits were very poor, with abnormally high probabilities of damage at low demand. Fitting by maximum likelihood, as recommended by Baker (2015) for limited data, followed the overall trend much better. The fitted functions are:
| Component | Demand parameter | Observations | Field median, η | Field dispersion, β | PACT comparison |
|---|---|---|---|---|---|
| Gypsum partition walls | Peak storey drift | 494 | 0.13% | 0.69 | C3011.001a, first damage state |
| Suspended ceilings | Peak floor acceleration | 270 | 0.71 g | 0.50 | C3032.001a, first damage state |
What the comparison shows
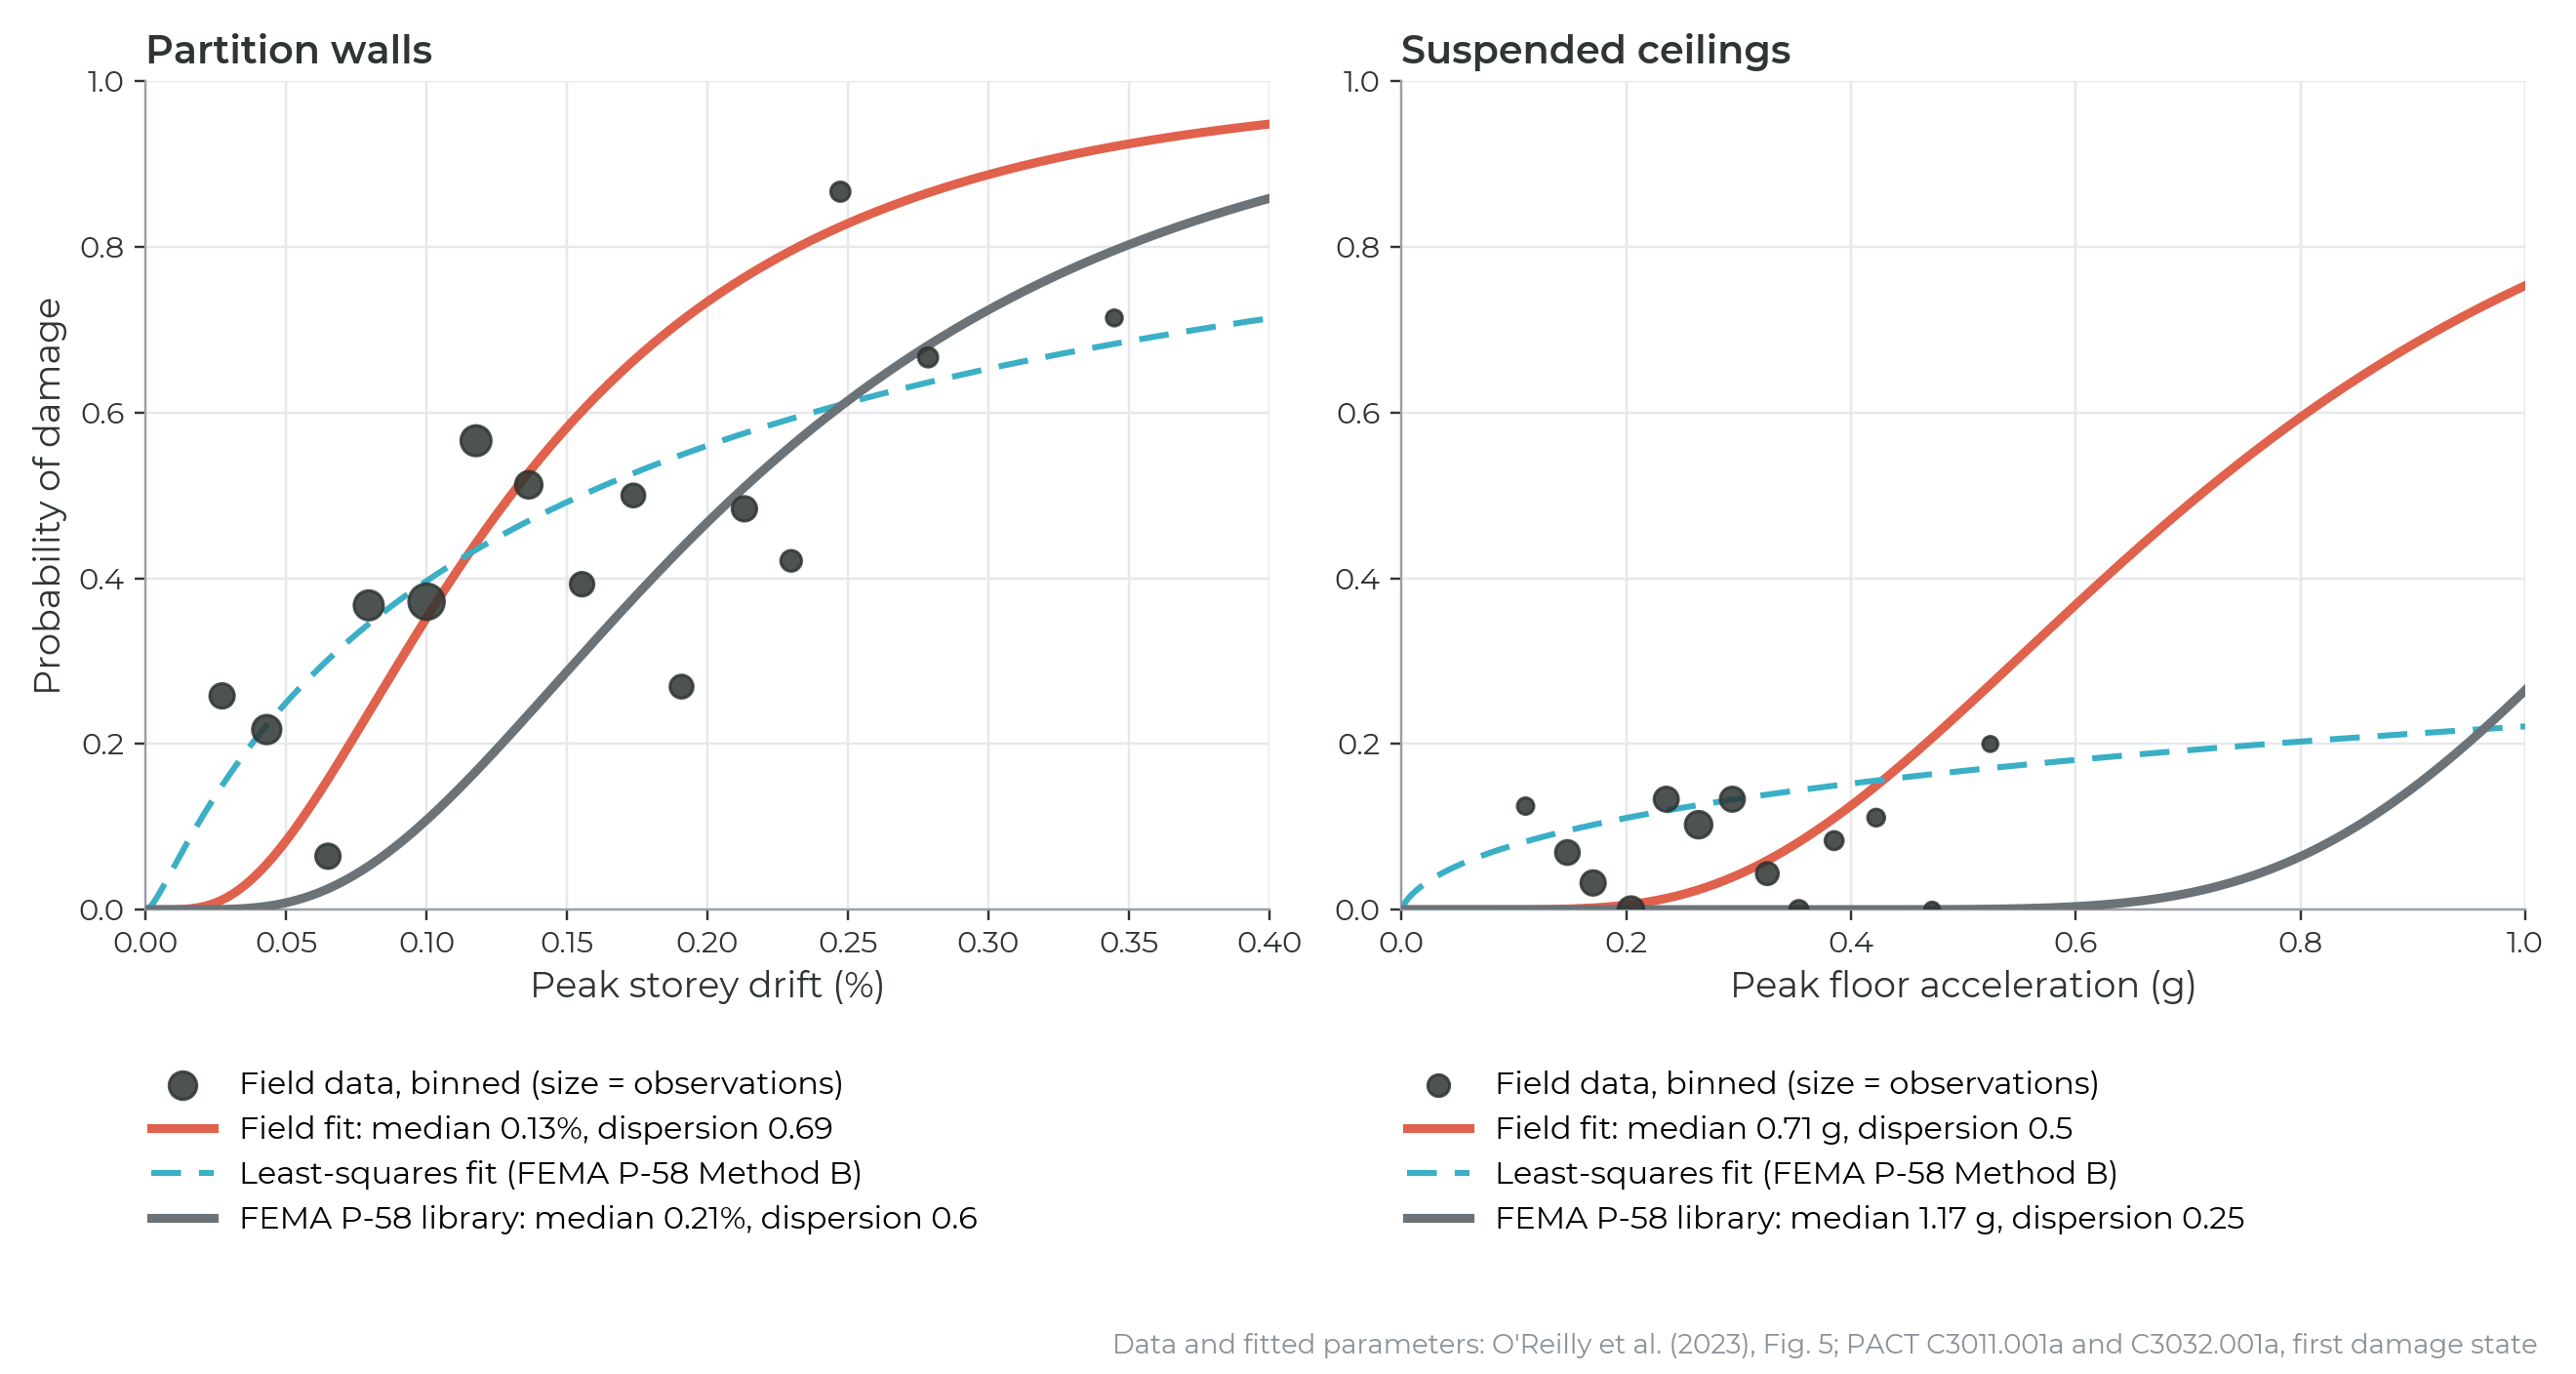
Compared with the PACT library functions for the same components, the field medians were around 38% lower for both partitions and ceilings, while the dispersions were quite similar. In other words, real partitions and ceilings were damaged at lower demands than the standard models assume, and the difference showed up in the median, not in the dispersion that FEMA P-58 inflates to cover it.
The authors call this a preliminary observation, for good reasons:
- it comes from one earthquake and a limited number of buildings, so observations in different bins are probably not independent, which violates an assumption of maximum likelihood fitting;
- the buildings were all commercial offices;
- damage was recorded as yes or no, without a degree of severity;
- for the ceilings, most observed accelerations were below the fitted median, so the upper part of that curve rests on little data.
Even so, the dataset is reasonably large, and it supports the concerns about laboratory data listed above. The broader point is that SHM records, paired with damage surveys after an event, can complement laboratory tests and improve the fragility functions used for NSEs. Every monitored building that goes through an earthquake, followed by a structured damage survey, adds to that evidence for its own type of building.
What did building owners actually care about?
The second half of the paper turns from damage to consequences. Buildings with q-NAVI experienced significant shaking in the 2018 Osaka and 2018 Hokkaido Eastern Iburi earthquakes, with no significant structural damage but a range of NSE damage: cracked gypsum partitions, water leakage from piping, fallen ceiling tiles and failed mechanical devices. Building managers, on site and at headquarters, and eventually the owners concluded that much of this was not a critical issue.
| Damage | What owners did | Why |
|---|---|---|
| Diagonal cracking in gypsum partitions | Tolerated; often left to the next refurbishment cycle | Alarming at first, but did not affect the use of the building |
| Doors jammed by distortion | Tolerated unless they blocked access or egress | Dealt with by extra force, or left open |
| Burst water pipes | Repaired urgently | Flooding ruined furnishings and made areas unusable |
| Failed mechanical services | Repaired urgently | Air conditioning and heating are essential in summer and winter |
| Dislodged exterior cladding tiles | Repaired urgently, often at a premium | Safety of pedestrians and occupants |
Under FEMA P-58, diagonal cracking in partitions can be expensive: replacing partitions throughout the building, then repainting and redecorating, at a time when labour and materials are scarce. In practice, occupants viewed the cracks with some amusement after a couple of days, cleaned up and got back to "business as usual". What mattered was whether the building worked. That is the question a post-event assessment should answer first, which is why our decision support orders repairs by what stops the building working, not by the size of the bill.
Two caveats from the paper. First, the calm response of occupants in Japan owes much to earthquake education, preparedness and frequent exposure; people elsewhere may react differently. Second, these were commercial buildings with one centralised owner who could decide for the whole building. A residential building with many owners would find such decisions harder to align.
Recovery states: full recovery is not the only target
Standard loss assessment assumes full recovery: every damaged item is repaired before the building is considered back in service, down to each cracked partition and each jammed door. The field observations show that owners often aim for something less.
A recovery state (RS) is the level of recovery a building owner targets after an earthquake. Frameworks for downtime have already moved beyond full recovery:
| Recovery state | FEMA P-58 | REDi | Molina Hutt et al. (2022) |
|---|---|---|---|
| Full recovery (RS1) | ✓ | ✓ | ✓ |
| Functional recovery (RS2) | ✓ | ✓ | |
| Re-occupancy (RS3) | ✓ | ✓ | |
| Shelter-in-place (RS4) | ✓ | ||
| Stability (RS5) | ✓ |
The paper proposes applying the same thinking to economic losses. Assign each damage state of each component the recovery state it would prevent. Then, for a target recovery state, include in the loss assessment only the damage that must be repaired to reach it. The minor damage states of partitions, for example, are not needed for functional recovery, but damage to a water pipe is.
Case study: how much does the recovery target change the loss?
The approach was applied to a four-storey reinforced concrete frame designed to Eurocode 8 for a site in L'Aquila, Italy, previously analysed by Shahnazaryan et al. (2022). The building was modelled in OpenSees, analysed with incremental dynamic analysis, and its losses were computed with storey loss functions (Shahnazaryan et al. 2021). Each damage state of each structural and non-structural component was assigned a recovery state: the first two damage states of internal partitions, for instance, only matter for full recovery, while the most severe damage state of beams and columns prevents even stability.
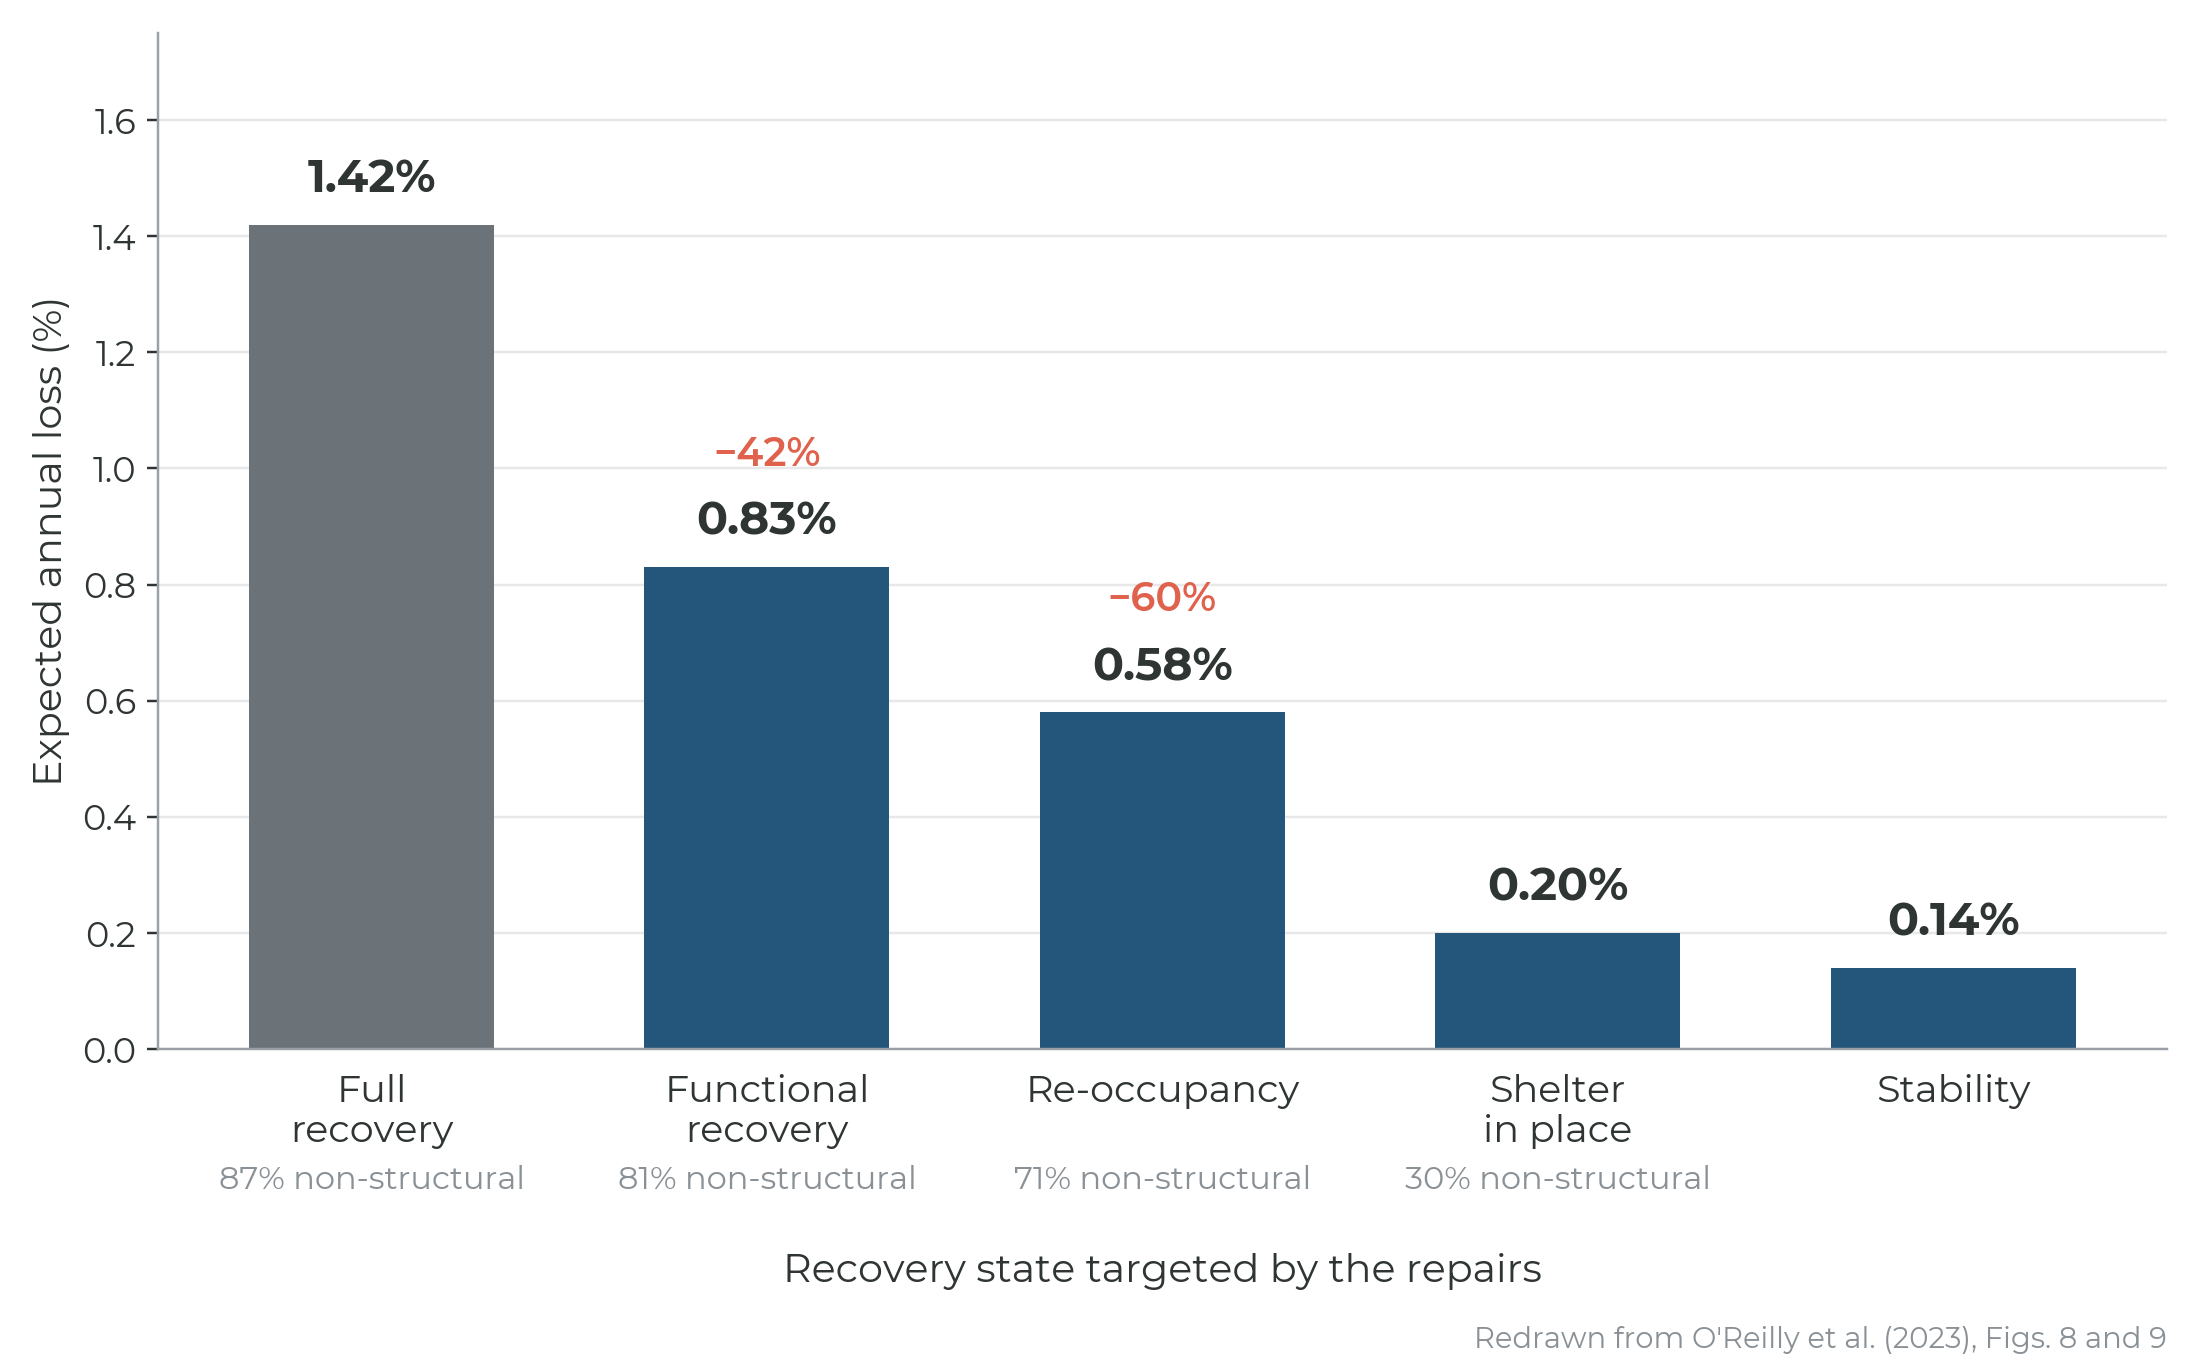
With full recovery, the assumption behind FEMA P-58, the EAL was 1.42%, and most of it came from repairing NSEs. Targeting functional recovery dropped it to 0.83% (−42%), and re-occupancy to 0.58% (−60%). The non-structural share of the loss fell as the target was relaxed, from 87% at full recovery to 71% at re-occupancy, because the NSE repairs that are not needed for those states no longer inflate the estimate. This agrees with field data from the 2011 Tohoku earthquake, where around 56% of the repair costs in an RC office building were for architectural components (Yoshizawa et al. 2014).
The absolute numbers depend on the structure, the site hazard and the component inventory. The point is the size of the difference: the same building and the same hazard give loss estimates that differ by a factor of more than two, depending only on which recovery the owner is aiming for. For that reason, the repair cost and downtime estimates in our risk and loss assessments and post-event studies are given for each recovery target, so the owner chooses with the numbers in front of them.
What does this mean in practice?
For engineers and decision-makers, the paper leads to three practical conclusions:
- Treat library NSE fragility functions with care. They may underestimate damage in real buildings. Where field data exist, use them to check or update the library functions; Method U of Porter et al. (2007) exists for exactly that.
- Use monitoring data as a source of fragility data. Floor records from SHM, combined with a structured damage survey after each event, produce the kind of data laboratories cannot. Recording the degree of damage, not just damaged or not, would make future surveys more useful.
- State the recovery state with every loss estimate. An EAL or a repair cost assumes a level of recovery. Saying which one makes the number interpretable, shows which components really drive it, and helps prioritise repairs and retrofits on what stops the building working rather than on cosmetic damage.
The third point has a timing side too. After a major earthquake, demand surges and so do prices. An owner who knows which repairs are essential for functional recovery can do those now and leave the rest to the next scheduled refurbishment, as the owners in Japan did.
From monitoring data to decisions after an earthquake
The Osaka study joined two things that are usually kept apart: what monitoring measured in each building, and what the owners then decided to do. The monitoring gave the peak demands on every instrumented floor within minutes of the earthquake. The picture of the damage, and of which damage mattered, came from surveys and interviews two months later.
After an earthquake, an owner asks four questions. Is anything damaged? Can people stay? What will the repairs cost? What do we fix first? A recorded response does not answer them directly. Between the sensor data and the decision sit the steps of a loss assessment, and this study improves two of them.
| Step | What it answers | What this study adds |
|---|---|---|
| 1. Sensor data | How the building responded: floor accelerations and drifts | Monitoring records from 26 buildings in a real earthquake |
| 2. Demand | How far each storey drifted and how hard each floor shook, including floors without sensors | Peak storey drifts obtained by integrating recorded floor accelerations |
| 3. Damage | The probability of damage for each component group on each floor: partitions, ceilings, pipes, cladding, structure | Fragility functions from real buildings, about 38% below the library medians |
| 4. Loss and recovery | Repair cost and downtime, and which repairs are needed for re-occupancy, functional recovery or full recovery | Recovery states in the loss estimate: 42–60% lower expected annual loss than full recovery |
| 5. Decision | Stay, inspect or close; what to check first; what to repair now and what can wait | What owners actually prioritised: damage that stops the building working |
This chain is what our post-event decision support service delivers. For a building, or a portfolio of buildings, it gives:
- damage estimates by floor and component group, structural and non-structural;
- inspection priorities: which buildings and areas to check first, and which can wait;
- repair cost and downtime as ranges, for re-occupancy, functional recovery or full recovery;
- a repair list ordered by what stops the building working, as the owners in Japan prioritised;
- a short report for owners, insurers and other stakeholders.
The same building model also works between earthquakes. Combined with the site hazard, it gives the expected annual loss and scenario losses for the recovery target the owner chooses, so the first decision after an event is not made from scratch.
Who it is for
- Building owners and facility managers who need to know whether to stay, inspect or close, and what to repair first.
- Portfolio owners and corporates deciding which sites need attention first and what downtime to expect.
- Insurers and risk managers who need expected losses and downtime per building, quickly, after an event.
- Public bodies prioritising schools, hospitals and other critical buildings.
- Monitoring and technology companies that want engineering analysis to go with their monitoring offer. Every event recorded by an installed system, followed by a structured damage survey, is the kind of data the Osaka study used, and it improves the fragility models for those buildings and similar ones.
How we work today
We deliver this through engineering studies and partnerships, and we are developing tools to automate parts of the chain. Our results support formal safety inspections and decisions by the responsible authorities; they do not replace them.
A first project needs little: one building with floor-level monitoring in a seismic area, and one recorded event. We build the building's model and component inventory, run the recorded event through the chain, and review the results with the owner: would these answers have changed what they did? No new sensors are needed to start.
Book a call to discuss a building, a portfolio or a partnership.
Further reading
- What is a fragility curve?: fragility and vulnerability curves, and how they are used in risk assessment.
- Storey loss functions for seismic loss assessment: the storey-based loss approach used in the case study, from a component inventory to repair costs.
- How to compute average annual loss: integrating a vulnerability function with a site hazard curve.
- Converting fragility and vulnerability models between intensity measures: another way the choice behind a loss model changes the expected annual loss.
Stay Tuned
Get in touch to discuss decision support for your monitored buildings, or see our post-event decision support and risk engineering consulting services. Stay tuned for more posts.
Frequently asked questions
What are non-structural elements in a building?
Non-structural elements are the components that do not carry the building's loads: partitions, doors, windows, ceilings, piping, mechanical services, cladding, furniture and contents. They usually account for most of a building's cost and dominate the repair costs in seismic loss assessments.
Are FEMA P-58 fragility functions for non-structural elements accurate?
They may underestimate damage in real buildings. Fitted to monitoring and survey data from 26 office buildings after the 2018 Osaka earthquake, the medians for partition walls and suspended ceilings were around 38% lower than the corresponding PACT library functions, with similar dispersions. The authors describe this as a preliminary observation from one earthquake.
Can structural health monitoring data be used to derive fragility functions?
Yes. Floor records give the maximum demand each component experienced, and a damage survey after the event tells whether it was damaged. Fitting a lognormal fragility function to such data by maximum likelihood gave much better results than least-squares regression on binned data.
Which non-structural damage matters most after an earthquake?
Damage that stops the building working. After the 2018 Osaka and Hokkaido earthquakes, owners of commercial buildings in Japan tolerated cracked partitions and jammed doors, but repaired burst water pipes, failed air conditioning and heating, and loose exterior cladding urgently.
What is the difference between full recovery and functional recovery?
Full recovery means every damaged item is repaired and the building is restored to its pre-earthquake condition. Functional recovery means the building can be used for its intended purpose again, even if minor damage, such as cracked partitions, has not been repaired yet.
How can building monitoring data support decisions after an earthquake?
Floor records give the demand on each storey. Fragility functions turn demand into the probability of damage for each component group, and a loss model turns damage into repair cost and downtime for the recovery state the owner targets. The result answers the owner's questions: whether to stay, inspect or close, what to check first and what to repair now.
How does the targeted recovery state affect expected annual loss?
Strongly. In a four-storey reinforced concrete case-study building, the expected annual loss was 1.42% for full recovery, 0.83% for functional recovery and 0.58% for re-occupancy: reductions of 42% and 60%, mainly because non-structural repairs not needed for those states were no longer counted.
References
- O'Reilly GJ, Hasegawa K, Shahnazaryan D, Poveda J, Fukutomi Y, Kusaka A, Nakashima M (2023) On the fragility of non-structural elements in loss and recovery: Field observations from Japan. Earthquake Engineering & Structural Dynamics. DOI: 10.1002/eqe.4066
- Engle HM (1929) The earthquake resistance of buildings from the underwriters' point of view. Bulletin of the Seismological Society of America 19(2): 86–95.
- Taghavi S, Miranda E (2003) Response assessment of nonstructural building elements. PEER Report 2003/05.
- FEMA (2018) FEMA P-58-1: Seismic Performance Assessment of Buildings.
- Porter K, Kennedy R, Bachman R (2007) Creating fragility functions for performance-based earthquake engineering. Earthquake Spectra 23(2): 471–489. DOI: 10.1193/1.2720892
- Baker JW (2015) Efficient analytical fragility function fitting using dynamic structural analysis. Earthquake Spectra 31(1): 579–599. DOI: 10.1193/021113EQS025M
- Huang J, Kurata M, Kawamata Y, Kanao I, Qi L, Takaoka M (2022) In-plane damage of partition walls with various boundaries during earthquakes. Earthquake Engineering & Structural Dynamics 52(4): 1059–1077. DOI: 10.1002/eqe.3802
- Kanda K, Nakashima M, Suzuki Y, Ogasawara S (2021) "q-NAVI": a case of market-based implementation of structural health monitoring in Japan. Earthquake Spectra 37(1): 160–179. DOI: 10.1177/8755293020935884
- O'Reilly GJ, Perrone D, Fox M, Monteiro R, Filiatrault A (2018) Seismic assessment and loss estimation of existing school buildings in Italy. Engineering Structures 168: 142–162. DOI: 10.1016/j.engstruct.2018.04.056
- Almufti I, Willford M (2013) REDi™ rating system: resilience-based earthquake design initiative for the next generation of buildings.
- Molina Hutt C, Vahanvaty T, Kourehpaz P (2022) An analytical framework to assess earthquake-induced downtime and model recovery of buildings. Earthquake Spectra 38(2): 1283–1320. DOI: 10.1177/87552930211060856
- Shahnazaryan D, O'Reilly GJ, Monteiro R (2021) Story loss functions for seismic design and assessment: development of tools and application. Earthquake Spectra 37(4): 2813–2839. DOI: 10.1177/87552930211023523
- Shahnazaryan D, O'Reilly GJ, Monteiro R (2022) On the seismic loss estimation of integrated performance-based designed buildings. Earthquake Engineering & Structural Dynamics 51(8): 1794–1818. DOI: 10.1002/eqe.3638
- Yoshizawa M, Nagae T, Kajiwara K, Nakashima M (2014) Analysis on earthquake damage to non-structural components and furniture sustained by low-rise RC-building and process of recovery from damage. Journal of the Japan Society of Civil Engineers: 521–528.